
Survey Report: How Adventists Voted in the United States Presidential Election
By John T. Gavin, William W. Ellis and Curtis J. VanderWaal, November 25, 2016: The Adventist faith presents a challenge to modern culture in the earth’s last days and faces a challenge in its witness on today’s vital social and political issues. An understanding of Adventist social and political opinions is key to facing this challenge, to shaping our individual ministry expression, and to engaging corporately to create a place that is more just and meets the needs of all. The aim of the 2016 National Election Survey was to provide a partial understanding of these challenges.
Just days after Donald Trump’s surprising victory in the 2016 United States national election we asked Spectrum and Adventist Today readers to participate in a short survey about their religious and political leanings, voting behaviors, and positions on several controversial social issues. We asked questions similar to those found in most public opinion polls such as the Gallup Poll, replicating our previous surveys of Adventist Today readers, Adventist pastors, and faculty and staff of Adventists colleges and universities. We also asked questions from surveys of Adventists conducted by Roger Dudley and Edwin Hernandez in the past.
Our Sample
More than 1,600 responded, most of them immediately. Most respondents were born in the U.S. (81 percent), more than half (57 percent) were male, and three in four were married. Around 15 percent were single and never married and fewer than one in ten were separated or divorced. The age distribution of our sample was relatively even, with one-quarter ages 18 to 35, approximately one-fifth 36 to 50, over one-fourth each aged 51 to 65 and over 65. More than one-third had annual household incomes over $100,000, around 15 percent between $75,000 and $100,000, nearly 20 percent between $50,000 and $75,000, and around 20 percent $50,000 or less. Finally, our sample’s ethnic background is three-fourths White with all others – Latino, Black, Asian, Multi-Racial – each at 8 percent or less. Eighty-five percent of our sample had four years of college or more.
Our Findings
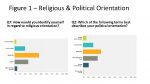
Our sample had a range of religious and political leanings. As indicated in Figure 1, nearly half considered themselves moderate in their religious orientations. About one in five considered themselves to be religious conservatives, while about one in four were liberal in their religious orientation. Slightly more than three percent identified as fundamentalist. Figure 1 also shows the respondents’ political orientations. Political orientation mirrors religious orientation, with greater than 30 percent identifying as political moderates. Liberals/progressives and strong liberals/progressives represented nearly 40 percent of the sample. Those who are conservative or strong conservatives represented one-quarter of the respondents. This is in line with findings of previous studies showing that religious and political orientations are closely aligned.
In party affiliation, our respondents were divided roughly into thirds between Democrats, Republicans, and Independents. There were slightly more Democrats (32 percent) than Republicans (28 percent) or Independents (29 percent). Significantly, about one in twenty had not registered to vote.
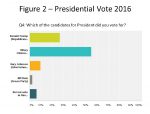
Figure 2 shows respondents’ votes for President in the election earlier this month. More than half of respondents (55 percent) voted for Hillary Clinton, more than twice the number who voted for Donald Trump (27 percent). Only about 10 percent voted for Libertarian Gary Johnson and about two percent for Green Party candidate Jill Stein.
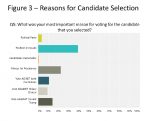
When we asked respondents (Figure 3) to indicate the single most important reason for voting for the presidential candidate they selected, four in ten said their choice was based on the candidate’s position on issues important to them, and more than two in ten cited “fitness for the presidency” as most important. Almost an equal number (about 10 percent) voted either against both candidates or against Hillary Clinton, and about 14 percent voted against Donald Trump, with more than one-third casting a protest vote. About six percent did not vote in this election.
When asked who they voted for in the 2012 election, more than half said Barack Obama, while just over one-third chose Republican challenger Mitt Romney, with very limited apparent protest voting. Around 15 percent said they did not vote in the 2012 election, less than half the number who did not vote in 2016, suggesting more vigorous overall interest in 2016. Though some have suggested that many Obama voters in 2012 voted for Trump in 2016, there was no apparent evidence of this shift among our Adventist respondents, who maintained roughly the same level of support for Democratic candidates in both elections.
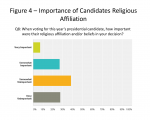
Respondents were asked how important the presidential candidates’ religious affiliations were as a factor in their voting decisions. Figure 4 shows the range of responses indicating that more than one in three considered it important or very important. Twice as many (66 percent) considered candidates’ religious affiliations as somewhat unimportant or very unimportant. This majority is not surprising in view of Adventists’ strong positions on the separation of church and state.
Finally, respondents were given the opportunity to post open-ended comments at the end of the survey. Our preliminary review of the comments suggests a broad range of opinions on the 2016 election and related political and social issues.
Conclusions
Our findings represent the views of a large number of Spectrum and Adventist Today readers in the United States; largely white, married men and women across a broad range of ages who are likely to enjoy an upper socio-economic status. They represent a wide range of religious and political leanings and party affiliations. While this sample may in some ways not represent the general Adventist population in the U.S., there is an apparent indication of a shift from conservative religious and political leanings to more moderate views, as their voting in 2012 and 2016 U.S. elections indicates a preference for more moderate, liberal/progressive versus conservative candidates for President. However, because of the number of protest votes, the unusual nature of the 2016 campaigns, and the results of the election, it may be difficult to draw long-term conclusions from this year’s election. Adventists who participated in this survey were clearly more involved in this election than in 2012. More people voted in the 2016 election, indicating a more intense involvement in the electoral process. A majority of those who did vote indicated that their favored candidate’s position on issues was the most important reason for their vote, again indicating more intense involvement in this election. Finally, Adventists in our sample were actively engaged in the political process and in the discourse as indicated by the number and the nature of the comments.
Rapidly changing social and political forces make it more difficult for Adventists to maintain foundational beliefs and to become a more relevant witness on important religious, social and political issues. We hope this information is helpful in facing this challenge. Findings from our survey questions about controversial social issues, along with an analysis of the 400 or so comments, will be the subject of a future article.
John Gavin is director of the social work program at Washington Adventist University. Dr. William Ellis is professor of history and political studies at Washington Adventist University. Dr. Curtis VanderWaal is chair of the department of social work at Andrews University. This survey was conducted in collaboration with Adventist Today and the Association of Adventist Forums.


